Zoning Impacts on Vehicle Miles Traveled: The Cases of Fayetteville and Birmingham
Aidan Raffaele
As the discourse and research around climate change and its effects develops,[1] city governments have emerged as an increasingly useful agent of change.[2] The federal government and state governments are seen more and more as slow-moving in regards to the climate problem and also have been proven relatively unable to create solutions that properly address specific needs, instead needing to implement “one-size-fits-all” solutions.[3]
The city, however, has the potential to tailor solutions to their own needs and capabilities. Although resources may be more limited, the increased effectiveness of the measures that are implemented as a result of such tailoring, as well as other factors like community involvement, have the potential to make up for that lack of resources, especially when the aggregation of cities is taken together.[4] Transportation has emerged as a focal point of this discussion, due in part both to the autonomy that cities have in determining transportation policies and transportation’s contribution to U.S. emissions output.
The question then emerges as to what can cities do and how much can they control their own destiny regarding climate policy?[5] That question requires an inquiry into whether the policies of cities affect their climate-friendly status, or whether this is predetermined as a result of factors ranging from the climate of the city to its zoning laws and size. To do so, the following analysis implements a case-study method to compare the zoning of two cities – Fayetteville, NC and Birmingham, AL – with similar sizes and populations and drastically different vehicles miles traveled. In 2018, residents of Fayetteville drove 1,402,397,335 miles, and residents of Birmingham drove 3,313,880,152 miles, which is over double Fayetteville’s vehicle miles traveled.[6]
Fig. 1: Fayetteville Zoning Map[7]
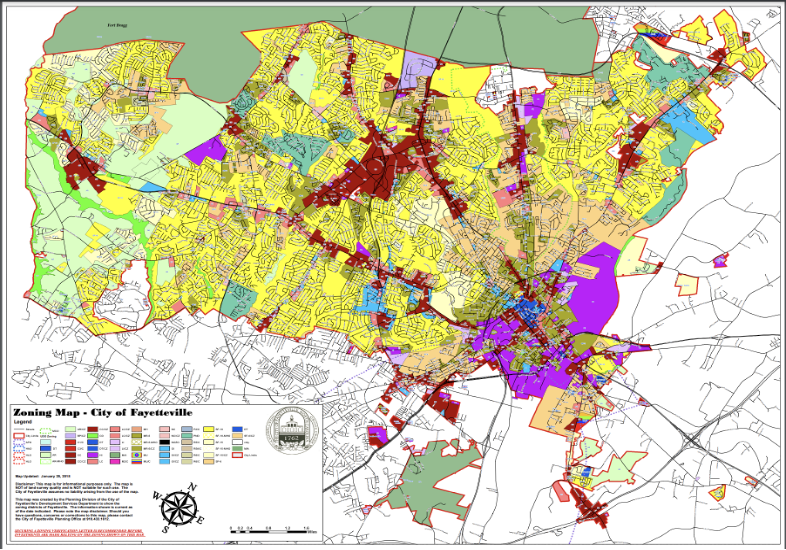
Fayetteville takes a semi-circle shape, with the roads coming from the downtown area (the dark blue area surrounded by purple in the bottom right) resembling a wheel and spoke which creates a straight lines navigation of the city.[8] These spokes have commercial zones along them, which are almost unavoidable when utilizing the main roads that extend out into the residential areas of the city.[9] Fayetteville does have some offshoots from the main city, but they are close not just to the main body of the city but to the more visited and used downtown area.[10]Furthermore, a clear industrial district exists that sits at the base of the semi-circle (the purple), making it as centrally located as possible while still being on the edge of the city.[11] Lastly, the industrial district is near the downtown area, making it a beneficiary of the wheel and spoke system that allows for more direct routes to the area.[12]
Fig. 2: Birmingham Zoning Map[13]
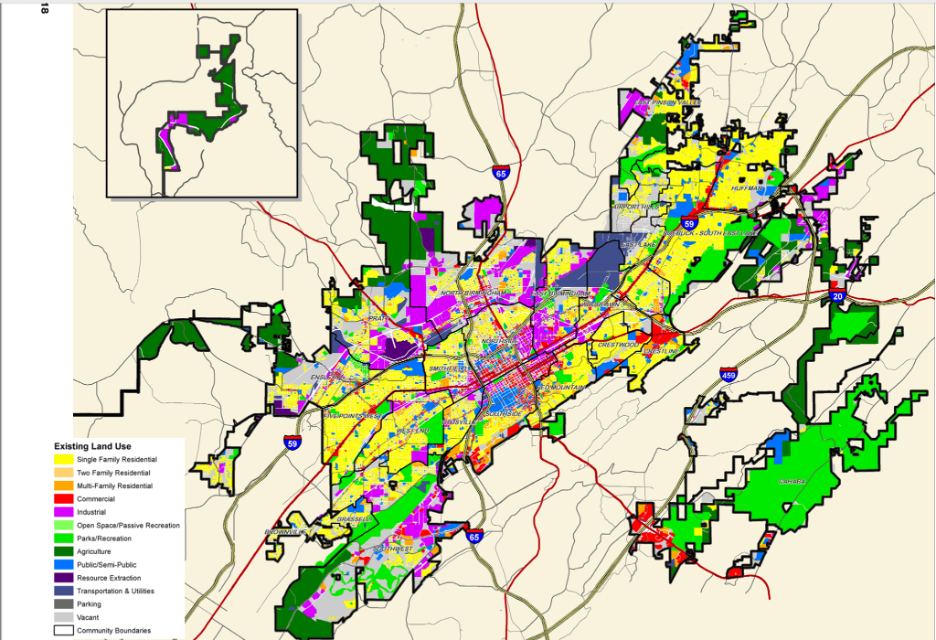
The boundaries of Birmingham take the shape of a vaguely rectangular blob, with off shooting annexes that stretch for miles from the city center itself.[14] This shape makes the end-to-end distance of the city far longer than that of Fayetteville. Birmingham’s industrial and commercial zoning is also disjointed.[15] Industrial zoning (purple) occupies disconnected pockets of space, mostly around the perimeter of the city, with one significant chunk in one of the annexes (presumably connected to the agriculture that makes up the rest of that annex).[16] The commercially zoned areas (red), while fragmented, are generally around a centralized downtown area.[17] The logical result of these fragmentations is that people need to make multiple and/or extended trips to go to work, shop, go to restaurants and banks, and more, which once again inherently increases vehicle miles.[18]
The differences in the zoning between the two cities likely have important impacts on the vehicle miles. First, the shapes themselves have logical implications on the vehicle miles. End to end trips in Birmingham are longer than in Fayetteville.[19] More important is the distribution of the zones themselves. Zoning in Birmingham takes a fragmented shape, specifically with the commercial and industrial zones, meaning the routes of multi-purpose trips (for example, to work and running errands) are likely to be less efficient.[20] In addition to the fragmentation, the zones are more spread out around the perimeter of the city.[21]
Fayetteville’s wheel and spoke shape branching off of the downtown area allows for such trips to be more efficient, increasing the likelihood that all of the necessary stops are along the same route that would normally be taken without the extra stops.[22] The centralized downtown and industrial zone in Fayetteville make this system even more efficient, as the distance to this central area from a given point in the city is likely to be shorter while also requiring a trip along one of the commercial spokes.[23] The annexes in Birmingham, alongside with the industrial and farming activities that takes place in them, further increase the vehicle miles in the city. This structure either requires workers who live in the rest of Birmingham to commute to the annex or to bring in additional workers from outside of the city, thereby creating a larger population driving in Birmingham.[24] Fayetteville, on the other hand, has less of an issue with annexes, as they are considerably closer to the city itself. This decreases the vehicle miles for Fayetteville residents and increases the likelihood that Fayetteville residents work there.[25]
Although this is only an analysis of two cities, the comparison implicates at least one possible explanation for the drastic difference in vehicle miles.[26] Given the magnitude of the discrepancy between Fayetteville’s 1.4 billion miles driven and Birmingham’s 3.3 billion miles, it is likely that there are far more factors at play, some of which are likely policy based, and others of which are based on geography and history.[27] However, this analysis suggests that cities can be the victims of past city planning policy, giving them a predisposition for higher vehicle miles and therefore a greater impact on the environment and greenhouse gas emissions. This takeaway could be directed to educate cities in looking towards toward the future when enacting long-lasting land use and transportation planning policies, especially when it comes to climate change.
[1] See, e.g, Hans-Otto Pörtner et. al., Climate Change 2022: Impacts, Adaptation and Vulnerability, Intergovernmental Panel on Climate Change (2022); Eli Tziperman, Global Warming Science: A Quantitative Introduction to Climate Change and Its Consequences, Princeton University Press (2022).
[2] See, e.g., Sara Hughes, Repowering Cities (2019); Benjamin Barber, If Mayors Ruled the World (2014).
[3] John S. Dryzek et. al., The Oxford Handbook of Climate Change and Society 4 (2011).
[4] Derik Broekhoff et. al., Stockholm Environment Institute, What Cities Do Best: How to Maximize the Role of Cities in a Low-Carbon Future3 (2015).
[5] Sources of Greenhouse Gas Emissions, EPA (November 16, 2023), https://www.epa.gov/ghgemissions/sources-greenhouse-gas-emissions. Electricity production accounts for 25% of US emissions, the industrial sector makes up 24%, the commercial and residential sectors account for 13%, and agriculture makes up 11%.
[6] For the areas and populations of the cities see Quickfacts: Fayetteville City, North Carolina, United States Census Bureau (July 1, 2023), https://www.census.gov/quickfacts/fact/table/fayettevillecitynorthcarolina/PST045223 (208,470 people and 148.26 square miles); Quickfacts: Birmingham City, Alabama, United States Census Bureau (July 1, 2023), https://www.census.gov/quickfacts/fact/table/birminghamcityalabama/VET605222 (196,910 people and 147 .03 square miles). For vehicle miles traveled data, see Megan Day, City and County Energy Profiles, United States Department of Energy (December 20, 2019), https://data.openei.org/submissions/149.
[7] Fayetteville Development Services Department, Zoning Map – City of Fayetteville, City of Fayetteville,(2018). https://www.fayettevillenc.gov/home/showpublisheddocument?id=8651.
[8] Id.
[9] Id.; see also Fayetteville Traffic Services Department, Traffic Services, City of Fayetteville, https://www.fayettevillenc.gov/city-services/public-services/traffic-services#:~:text=Major%20roads%20owned%20by%20the,Hay%20Street%2C%20and%20Person%20Street (last visited April 14, 2024).
[10] Id.
[11] Id.
[12] Id.
[13] Understanding Birmingham Today… For a Better Birmingham Tomorrow, City of Birmingham (2014), https://www.birminghamal.gov/wp-content/uploads/2017/08/CH3_UnderstandingBhamToday.pdf.
[14] Id. For a discussion of the impact of these additional trips, see Kieth Ihlanfeldt, Vehicle Miles Traveled and the Built Environment: New Evidence From Panel Data, 13 J. of Transp. and Land Use 23, 27 (2020)
[15] Understanding Birmingham, supra note 13.
[16] Id.
[17] Id.
[18] Ihlanfeldt, supra note 14.
[19] Zoning Map – City of Fayetteville, supra note 7; Understanding Birmingham, supra note 13.
[20] Understanding Birmingham, supra note 13. See also Ihlanfeldt, supra note 14.
[21] Understanding Birmingham, supra note 13.
[22] Zoning Map – City of Fayetteville, supra note 7.
[23] Id.
[24] Understanding Birmingham, supra note 13.
[25] Zoning Map – City of Fayetteville, supra note 7.
[26] Ihlanfeldt, supra note 14, at 40, 41.
[27] Id. For other examples of these other factors see also Michael Lewyn, Sprawl in Canada and the United States, 44 Urb. Law. 85 (2012); Joanna D. Malaczynski & Timothy P. Duane, Reducing Greenhouse Gas Emissions from Vehicle Miles Traveled: Integrating the California Environmental Quality Act With the California Global Warming Solutions Act, 36 Ecology L. Q. 71 (2009).